
When it comes to investing, you’ve got to decide what camp you are in.
Are you a market timer? Are you someone who believes in fundamental analysis? Do you believe in hiring experts who can do a better job than you? Do you believe in active investing? Or are you a passive indexer satisfied to sit on your behind and bet on the whole market?
No one wants to be passive. Passive people come in last. The passive tense is weak. Passive aggressive behavior is annoying.
But when it comes to investing, passivity pays. And thinking you’re smarter than the room almost never does.
There are many reasons for this:
1. Timing the market requires more transactions to get out of perceived weak positions and into strong ones.
2. More transactions mean more transaction costs and more capital gains. And more capital gains mean more loss of profits to taxes.
These facts are reflected in the expense ratios of active versus passive funds. Active funds (in which smart Wall Street types are buying and selling positions in order to take advantage of market inefficiencies revealed by their bang-up research teams) cost significantly more than passive funds (where smarter Wall Street types merely try to match the exact positions of an economic index which they are tracking….. Note there are no research teams on their payroll.)
And remember, the expense ratio represents money which is taken away from the money that goes into the investor’s pocket. And that lost money never has the opportunity to participate in the magic of compound earnings in which money grows in an ever more accelerated fashion over time.
So an annual 1% here or 1.5% there end up costing thousands and thousands and thousands of dollars by the time the investor retires.
Which would all be well and good if the active investors outperformed their corresponding indices by an greater amount than their fees cost.
Sadly, that is not the case.
The following table is excerpted from Rick Ferri’s excellent book, The Power Of Passive Investing.
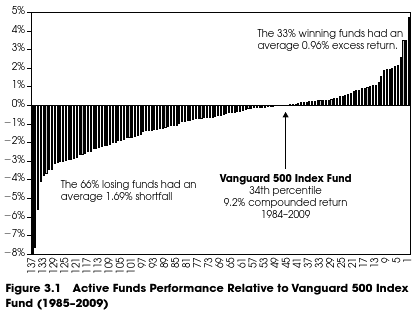
This table compares the performance of large-cap active funds to the Vanguard 500 index fund over 14 years.
Every black bar stretching below zero represents an active fund that lost to the Vanguard S&P 500 index fund.
And every black bar that stretches above zero represents a fund that beat the index.
So what do we observe?
1. Two thirds of the active funds were outperformed the index fund.
2. The winning active funds beat the index by 0.96% on average
3. The losing active funds lost to the index fund by an average of 1.69%
This is akin to playing a game with a three sided dice. (I’ve never seen one but I imagine it would look something like a football with three flattened sides?)
On the dice there are two sides with red dots and one side with a blue dot.
If you are an active investor you’re betting on the blue dot.
But it gets better. If you’re lucky enough to hit the blue dot you win 96 cents. And if you lose and one of the two the red dots comes up? You lose $1.69.
Do you want a piece of that action?
 Would you like to invest in my strategic active fund?
The argument could be made that the one third of active fund managers who won were the smart ones, and the two thirds who lost were just not up to the task of intelligent active management.
But this is not the case. When researchers look at the probability of future success for the top third of the active managers when compared to the bottom two thirds of active managers, The previous winners are the most likely to fail in the future and the bottom third managers are the most likely to succeed.
And the longer the observed period…the less likely any active fund is to beat the index.
In other words those active managers who win are usually just lucky.
Identical graphs are presented in Ferri’s book for almost every sector of the investment world.
Large cap funds, small cap funds, value funds, growth funds, domestic funds, foreign funds, emerging market funds, bond funds… They all show the same pattern.
Why is there this consistent pattern of underperformance amongst active funds?
It’s the fees.
Trackbacks/Pingbacks
[…] will remember that in passive aggression, we discussed how active managers have a roughly 2/3 probability of underperforming the low-cost […]
[…] probably going to invest in the stock market. And we’re definitely going to invest in low-cost […]