
A little over year ago I took a drastic step. I moved all of my retirement account holdings away from the safety of a conventional buy-and-hold passive index portfolio, and towards a different approach; an approach riddled with dangerous taboos.
- It was an active approach.
- It was market timing.
- It was dual momentum investing, more specifically Global Equities Momentum (GEM).
And I wrote about it. I wrote about my reservations, my motivations, the knowns, the unknowns, why I thought it was likely to work for me, and why it was almost sure to be simple but not easy for me to stick to the plan.
And since that time, a lot has happened.
- I started a successful online business, with my friend Brad Barrett, systematically teaching people how to play the miles game from square one.
- My medical practice became evermore busy, with weekdays off increasingly becoming a thing of the past.
- I tangled with the moderator over at Mr. Money Mustache’s forum, (not to be confused with Pete, Mr. Money Mustache himself, who is truly a stand up guy) about dual momentum one too many times, and got myself booted from the forum for good in an ugly display of moderator overreach.
Which is all to say: I’ve been busy.
In other words, I haven’t done a lot of writing here about my actual experience investing this way since I took the leap.
And now that it’s been more than a year, I figure it’s time for an update.
Where to begin? Well if you’re anything like me and you are a performance chasing fool, you’ll want to know how the whole thing worked out. Did dual momentum beat the market? Did it diminish drawdowns?
So before I get to my analysis of the experience, I’ll skip to the punchline.
It didn’t beat the market.

(The Horror…the horror…)
How it went down…
I began this experiment at the beginning of September 2014 when I moved over all of my retirement holdings into VIIIX, vanguard’s institutional S&P 500 fund.
And there it stayed until May 1, 2015.
Over those 9 months VIIIX Returned 5.54%.
At the end of April I got my first signal to make a trade. For the six months preceding May 1, FSPNX (fidelity’s International developed market index fund) had outperformed both short-term treasuries, and the S&P 500. So prior to open on April 1 I moved my holdings to FSPNX, and there they remained until September 1, 2015.
Over those five months FSPNX returned -8.4%. (Greece happened). During that same time period, The S&P 500 returned -4.7%.
And then in August we had our first big correction, and the markets entered an extremely volatile and negative period, giving both international developed markets and the S&P 500 a negative total return in the prior six months relative to short term treasuries.
And so before open on September 1, I moved all of my shares of FSPNX into VBITX (Vanguard’s short-term bond fund.)
And for the two months ending October 31, 2015, VBITX returned 0.11%. During that same time period, The S&P 500 returned 6.2%.
So all in all in 14 months of investing my nest egg using the dual momentum playbook, my retirement accounts returned – 2.8%.
And there are number of things that this result should tell you.
- If I had launched a dual momentum fund at the same time that I started investing my own nest egg in this manner, it’s safe to say that big money would not be flowing into my fund right about now.
- Dual momentum underperformed the S&P 500 by 8.2% (a very significant amount) over this time period.
- During my first two months in short term treasuries the S&P 500 ripped off an impressive rebound from its August lows, returning 5.7%. (I’m still in VBITX, so this chapter isn’t finished yet, but at this point, as I write this, it sure feels like the market volatility has passed for now. ) It was this flight to safety that caused the vast majority of my investing period’s underperformance.
- Of course I was not invested in 100% VIIIX, prior to adopting dual momentum, so my personal benchmark is not the S&P. My benchmark is what I was invested in before adopting this strategy. And luckily I wrote about my buy and hold portfolio before ever embarking on this journey. That portfolio returned -2.64% compared to my dual momentum portfolio’s return of -2.8% percent for this 14 month time period.
So the bullet point results for the past 14 months:
- Global Equities Momentum significantly underperformed the S&P 500.
- Global Equities Momentum displayed no significant difference in terms of performance from my previous buy and hold small value tilted internationally diversified portfolio.
- Global Equities Momentum’s underperformance was largely attributable to its 2 months in short term treasuries (thus far) during a bounce back of the stock market.
Now obviously in any active strategy, successful or not, there will be periods of negative tracking error during which time the strategy will significantly underperform the market. This is simply the cost of doing business for any american investor who decides not to invest 100% of his portfolio in the S&P.
And obviously the 14 month look back period is far too short of a timeframe to come to any meaningful conclusion about the odds of success for dual momentum as a long term investment strategy.
But the truth is that actually investing in such a strategy is experientially very different from backtesting a strategy. And feeling the undulations of performance in real-time of course raised some new questions.
It is these questions that I really wish to adress in this post.
Question number one: How unusual is it for global equities momentum to NOT outperform the S&P 500 on a yearly basis?****
Answer: more common than a coin flip coming up heads.
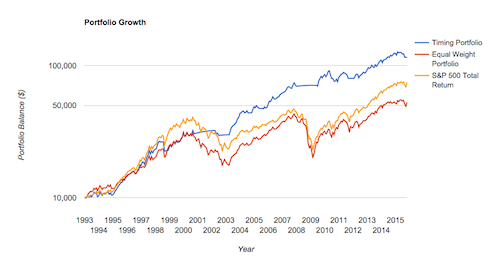
To answer this question I plugged in DFALX (foreign developed), VFINX (S&P 500), and cash into the portfoliovisualizer.com dual momentum back-tester, and examined annual returns from 1993 to present (The longest available period for review when including an index fund of international developed equities.)
The results were surprisingly balanced.
- Global equity momentum beat the S&P 500 for 10 of the 23 years.
- Global equity momentum lost to the S&P 500 for 10 of the 23 years.
- Global equity momentum and the S&P 500 had identical returns for three of the 23 years.
- So the odds of global equities momentum losing to the market on any given year was 43%, and the odds of losing or tying the market was 57%.
- And in losing years there was a wide range of possibilities in terms of the degree of global equities momentum underperformance.(-0.72% to -25.02%). Viewed in this light, an underperformance of 8% is hardly unusual, and a future underperformance of at least 25% is to be expected.
- The longest continuous period of underperformance was six years (going on seven) from 2009 until 2014.
Question number 2: How unusual is it for Global equities momentum to underperform the market while in cash? (This is a very important question I think, because a principal feature of the dual momentum strategy’s past success has been its ability to avoid big drawdowns during bear markets.)
Answer: it is extremely common.
- In looking back to 1993 there were 14 different timing periods where the dual momentum global equities momentum portfolio held cash as an asset. During those 14 different Holding periods, The S&P 500 outperformed global equities momentum 10 times.
- So if this is the base rate scenario, then a global equities momentum investor (like me) should expect with 71% certainty, that he will underperform the market each time he exits the market.
- And make no mistake about it, this underperformance can be significant and painful. Following the flash crash of 1998 global equities momentum underperformed the S&P 500 by 21% while in cash.
Question number 3: For those periods when the dual momentum investor held foreign equities instead of the S&P, how common was it for global equities momentum to underperform the S&P?
Answer: it was barely more common than a coin flip.
- In our back test there were 17 periods where the dual momentum investor held foreign equities.
- In nine of those 17 periods The S&P beat foreign equities in total returns.
- In 8 of those 17 periods foreign equities beat the S&P.
- The worst period of underperformance was May 1993 to November 1993 when global equities momentum was invested in foreign equities which underperformed the S&P 500 by 5.88%.
So let’s review what we have learned today.
If history holds, then as a global equities momentum investor trading on a six-month look back period , I should expect to…
- Underperform or tie the S&P 500 more than half the time on a yearly basis.
- Underperform for a single calendar year of returns by at least as much as 25%.
- Underperform the S&P 500 for at least six years in a row.
- Underperform the S&P 500 upwards of 70% of the time while holding cash.
- Underperform the S&P 500 about half of the time while holding international equities.
Which is precisely why this strategy, while simple, will never be easy.
This is a strategy which performs at its best during big bear markets. During those time periods I will still be losing money (particularly in my taxable accounts), just not as much. So my wins may not feel so sweet.
More than half the time I will feel I am losing to the market, because I will be.
And there’s no reason why there cannot be long stretches in the future where I will objectively be losing to the market year after year.
Those are the facts.
But I’m still very bullish on the strategy, and on my ability to stick with it through thick and thin.
This is because I have two fundamental beliefs when it comes to investing.
- An investor should keep it cheap.
- An investor should focus most of his energy on minimizing downside risk. (ie the permanent loss of capital.)
It in my view dual momentum has done a great job of achieving both of these goals. Particularly number two. And I see no reason why the future performance of this strategy should be any different.
But in the end, the proof will be in the pudding.
(Yesterday’s pudding)
***Note My results actually correspond to a timeframe of 14 months duration , not a year . Dual momentum looked better at the end of August which was the end of my first year investing this way. I chose this longer time period because it contained the most available data (even though it made GEM performance look considerably worse.)
The 12 month total returns for those interested from September 1, 2014 to September 1 2015, were….
- GEM: -2.86%
- VIIIX: 0.4%
- My prior portfolio: -4.84%
30 Responses to “Dual Momentum: A Year in Review”